The pystata magic
This magic includes features that are part of StataNow.
The %pystata line magic is used to configure the system and display current system information and settings. You can type %pystata? to view its documentation.
[35]:
%pystata?
Docstring:
Stata utility commands.

Line magic syntax:

    %pystata status

      Display current system information and settings.


    %pystata set graph_show True|False [, perm]

      Set whether Stata graphics are displayed. The default is to
      display the graphics. Note that if multiple graphs are
      generated, only the last one is displayed. To display multiple
      graphs, use the name() option with Stata's graph commands.


    %pystata set graph_size w #[in|px|cm] [, perm]
    %pystata set graph_size h #[in|px|cm] [, perm]
    %pystata set graph_size w #[in|px|cm] h #[in|px|cm] [, perm]

      Set dimensions for Stata graphs. The default is a 7.5-inch width
      and 4.5-inch height. Values may be specified in inches, pixels, or
      centimeters; the default unit is inches. Either the width or height
      must be specified, or both. If only one is specified, the other one
      is determined by the aspect ratio.


    %pystata set graph_format svg|png|pdf [, perm]

      Set the graphic format used to display Stata graphs. The default
      is svg. If svg or png is specified, the graphs will be embedded.
      If pdf is specified, the graphs will be displayed, and exported
      to PDF files and stored in the current working directory with
      numeric names, such as 0.pdf, 1.pdf, 2.pdf, etc. Storing the PDF
      graph files in the current directory allows you to embed them in
      the notebook when exporting the notebook to a PDF via Latex.


    %pystata set command_show True|False|default [, perm]

      Set whether to echo the commands in the output. True specifies
      that the commands to be executed be shown along with the output.
      False specifies that the commands not be shown in the output.
      default specifies that when a single-line Stata command is
      specified in the run() function of the stata module, or with
      either the %stata line magic command or the %%stata cell magic
      command, only the output is displayed; when a block of Stata
      commands is specified, each command and its output are displayed
      in sequence. %pystata set command_show is part of StataNow.


    %pystata set autocompletion on|off [, perm]

      Set whether to enable or disable autocompletion of Stata's
      variable names, macro names, r() results, e() results,
      and s() results from the current Stata session. on, the default,
      specifies that autocompletion be enabled; simply press the Tab key
      to use the autocompletion feature. off disables autocompletion.
      %pystata set autocompletion is part of StataNow.


    %pystata set streaming_output on|off [, perm]

      Set whether to display Stata's output while Stata is executing.
      on, the default, specifies that the output be displayed
      simultaneously while Stata is executing the code. off specifies
      that Stata's output be displayed after Stata finishes execution.
      %pystata set streaming_output is part of StataNow.


File:      c:\program files\stata18\utilities\pystata\ipython\stpymagic.py
%pystata status
This syntax displays system information and current settings. The system information includes the Python version currently in use, the version and edition of Stata in use, Stata’s shared library path, whether Stata was initialized successfully, and whether the Stata Function Interface (sfi) module was loaded successfully. The system settings include information on whether Stata’s graphs should be displayed, along with their dimensions and display format, and whether Stata commands and their output are displayed.
[36]:
%pystata status
    System information
      Python version         3.7.5
      Stata version          Stata 18.5 (MP)
      Stata library path     C:\Program Files\Stata18\mp-64.dll
      Stata initialized      True
      sfi initialized        True

    Settings
      graphic display        True
      graphic size           width = default, height = default
      graphic format         svg
      command display        default
      autocompletion         on
      streaming output       on
%pystata set graph_show True|False [, perm]
This syntax specifies whether Stata-generated graphics should be displayed in the cell. The default is True, meaning the graphs are displayed. Once you have specified this setting, it will be in effect for the remainder of the Python session, until it is set again. However, this setting will be forgotten once the current Python session is terminated. If you want this setting to be remembered and become the default setting when you open a new Python session, specify the perm option.
%pystata set graph_size w #[in|px|cm] [, perm]
%pystata set graph_size h #[in|px|cm] [, perm]
%pystata set graph_size w #[in|px|cm] h #[in|px|cm] [, perm]
This syntax is used to set the display dimensions for Stata-generated graphs. You can set one dimension or both. The aspect ratio is respected if only width or only height is set. If units are not specified, in is assumed. Once you have specified this setting, it will be in effect for the remainder of the Python session, until it is set again. However, this setting will be forgotten once the current Python session is terminated. If you want this setting to be remembered and become the default setting when you open a new Python session, specify the perm option.
Below, we set the width of Stata graphs to 4 inches.
[37]:
%pystata set graph_size w 4in
[38]:
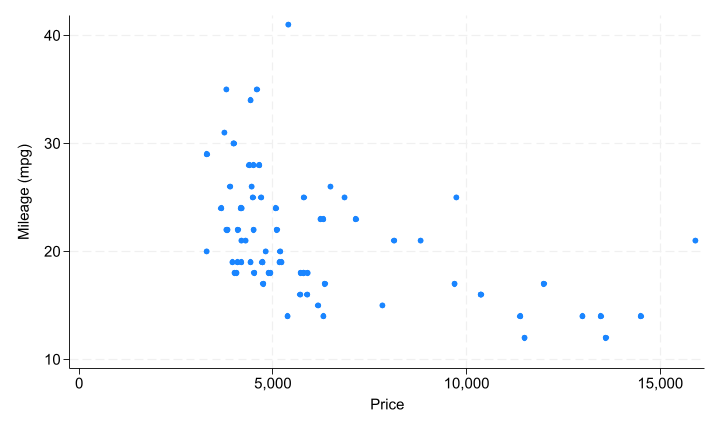
%%stata
sysuse auto, clear
scatter mpg price
. sysuse auto, clear
(1978 automobile data)

. scatter mpg price

.

Below, we set the height to 4.5 inches.
[39]:
%pystata set graph_size h 4.5in
[40]:
%stata scatter mpg price

%pystata set graph_format svg|png|pdf [, perm]
This syntax specifies the file format used to display Stata graphs. The default is svg. If svg or png is specified, the graphs are embedded, which means they are exported temporarily to SVG files or PNG files, which are then displayed in the output. If pdf is specified, the graphs are exported to PDF files in the current working directory with numeric names, such as 0.pdf, 1.pdf, 2.pdf, etc. This is useful when you try to export a notebook to a PDF via Latex, in which case the image has to be saved in the same directory as the notebook for the image to be embedded.
[41]:
%pystata set graph_format png
[42]:
%stata scatter mpg price
%pystata set command_show True|False|default [, perm]StataNow
This syntax specifies whether to echo the commands in the output. By default, when executing a single-line Stata command using the run() function of the stata module, or the %%stata or %stata magic, the command you specified will not be shown in the output; when executing a block of Stata commands using the run() function or the %%stata magic, each command and its output are displayed in sequence.
True specifies that the command(s) is displayed along with the output. False specifies that the command(s) is not shown in the output. default specifies that the default behavior described above is used.
Once you have specified this setting, it will be in effect for the remainder of the Python session, until it is set again. However, this setting will be forgotten once the current Python session is terminated. If you want this setting to be remembered and become the default setting when you open a new Python session, specify the perm option.
The following example runs the describe and summarize commands. We see that by default Stata commands are displayed along with their output.
[43]:
%%stata
describe
summarize mpg
. describe

Contains data from C:\Program Files\Stata18/ado\base/a/auto.dta
 Observations:            74                  1978 automobile data
    Variables:            12                  13 Apr 2022 17:45
                                              (_dta has notes)
-------------------------------------------------------------------------------
Variable      Storage   Display    Value
    name         type    format    label      Variable label
-------------------------------------------------------------------------------
make            str18   %-18s                 Make and model
price           int     %8.0gc                Price
mpg             int     %8.0g                 Mileage (mpg)
rep78           int     %8.0g                 Repair record 1978
headroom        float   %6.1f                 Headroom (in.)
trunk           int     %8.0g                 Trunk space (cu. ft.)
weight          int     %8.0gc                Weight (lbs.)
length          int     %8.0g                 Length (in.)
turn            int     %8.0g                 Turn circle (ft.)
displacement    int     %8.0g                 Displacement (cu. in.)
gear_ratio      float   %6.2f                 Gear ratio
foreign         byte    %8.0g      origin     Car origin
-------------------------------------------------------------------------------
Sorted by: foreign

. summarize mpg

    Variable |        Obs        Mean    Std. dev.       Min        Max
-------------+---------------------------------------------------------
         mpg |         74     21.2973    5.785503         12         41

.
[44]:
%pystata set command_show False
After command_show is set to False, only the output of the commands is displayed.
[45]:
%%stata
describe
summarize mpg
Contains data from C:\Program Files\Stata18/ado\base/a/auto.dta
 Observations:            74                  1978 automobile data
    Variables:            12                  13 Apr 2022 17:45
                                              (_dta has notes)
-------------------------------------------------------------------------------
Variable      Storage   Display    Value
    name         type    format    label      Variable label
-------------------------------------------------------------------------------
make            str18   %-18s                 Make and model
price           int     %8.0gc                Price
mpg             int     %8.0g                 Mileage (mpg)
rep78           int     %8.0g                 Repair record 1978
headroom        float   %6.1f                 Headroom (in.)
trunk           int     %8.0g                 Trunk space (cu. ft.)
weight          int     %8.0gc                Weight (lbs.)
length          int     %8.0g                 Length (in.)
turn            int     %8.0g                 Turn circle (ft.)
displacement    int     %8.0g                 Displacement (cu. in.)
gear_ratio      float   %6.2f                 Gear ratio
foreign         byte    %8.0g      origin     Car origin
-------------------------------------------------------------------------------
Sorted by: foreign


    Variable |        Obs        Mean    Std. dev.       Min        Max
-------------+---------------------------------------------------------
         mpg |         74     21.2973    5.785503         12         41
%pystata set autocompletion on|off [, perm]StataNow
This syntax sets whether to enable or disable autocompletion of Stata’s variable names, macro names, and r() results, e() results, and s() results from the current Stata session in an IPython environment. on, the default, specifies that autocompletion be enabled; simply hit the Tab key to use the autocompletion feature. off disable autocompletion.
Autocomplete variable names
Here is an example showing how the auto-completion works with Stata’s variable names. The current dataset in Stata is auto which contains 12 variables: make, price, mpg, etc. When you type m and then press the Tab key, a scrollable list of variable names that start with m will pop up. You can choose the one you want by pressing the down arrow key or you can continue typing and press Tab key conce the variable you want is the only remaining item in the list.

Note that autocompletion of variable names only work once the dataset has been loaded into Stata. For example, in the code shown below we would not be able to autocomplete the variable names with the list command because the auto dataset has not been loaded into Stata yet.

Autocomplete r()/e()/s() results
The following example shows how to easily fetch the e() results using tab-completion. After we run a linear regression model, several results are returned in e().
[46]:
%stata qui regress mpg weight foreign
When you type e( and then press the Tab key, a drop-down list appears containing the names of all current e() results. You can press the down arrow key to make your selection.

Or you can continue typing more characters and press the Tab key to filter out the returned result you do not want.

Autocomplete macros
To autocomplete global macro names simply type $ and then press the Tab key.

To autocomplete local macro names simply type ` and then press the Tab key.
[47]:
%%stata -qui
local i = 1
local name "Bill"
In the above cell, we created two local macros i and name. When we press the Tab key, a drop-down list containing all local macros pops up. Each macro name ends with ’ so that you do not need to type it.

%pystata set streaming_output on|off [, perm]StataNow
This syntax sets whether to display Stata’s output while Stata is executing. on, the default, specifies that any output be displayed simultaneously while Stata is executing the commands. When off is specified, Stata’s output will be displayed after Stata finishes execution of the specified commands.
Once you have specified this setting, it will be in effect for the remainder of the Python session, until it is set again. However, this setting will be forgotten once the current Python session is terminated. If you want this setting to be remembered and become the default setting when you open a new Python session, specify the perm option.